PASTA AL DENTE? Process for Automating Scientific and Technological Advancement: An Almost Developed End-to-End solutions
Last week, I played around with Claude Code to generate some social science research papers and they came out pretty well. Claude code can now generate regression discontinuity design (RDD) papers, each with original analysis, publication-quality figures, and LaTeX manuscripts—produced in a matter of minutes rather than months.
The papers span wildly different domains: generational value shifts in post-revolutionary Iran, the explosive growth of AI data center infrastructure, and age-based discontinuities in AI tool adoption. Yet the methodology was identical: feed the AI a dataset, specify an analytical framework, and let it handle everything from data cleaning to manuscript preparation.
Is this the future of social science? The answer, like the pasta in our acronym, is al dente—not quite fully cooked, but closer than you might think.
The Methodology: RDD Meets LLM
Regression discontinuity design is a quasi-experimental method beloved by economists and social scientists for its ability to identify causal effects at sharp thresholds. When treatment assignment changes discontinuously at a cutoff (like turning 65 for Medicare eligibility, or being born before vs. after a policy change), researchers can compare outcomes just above and below the threshold to estimate causal impacts.
Of course, natural experiment designs have many issues and can be unreplicable.[1]
As natural experiments often rely on the human 'eye' to verify their validity, the 'tinkering' that is often done in practice makes them prone to the multiple comparisons problem.[2][3] In contrast, automated discovery gets around this issue by using randomization to adjust for multiple testing and determine whether discontinuities are significant at level a prespecified alpha.[4]
Some regression discontinuities are bad: [5],[6]
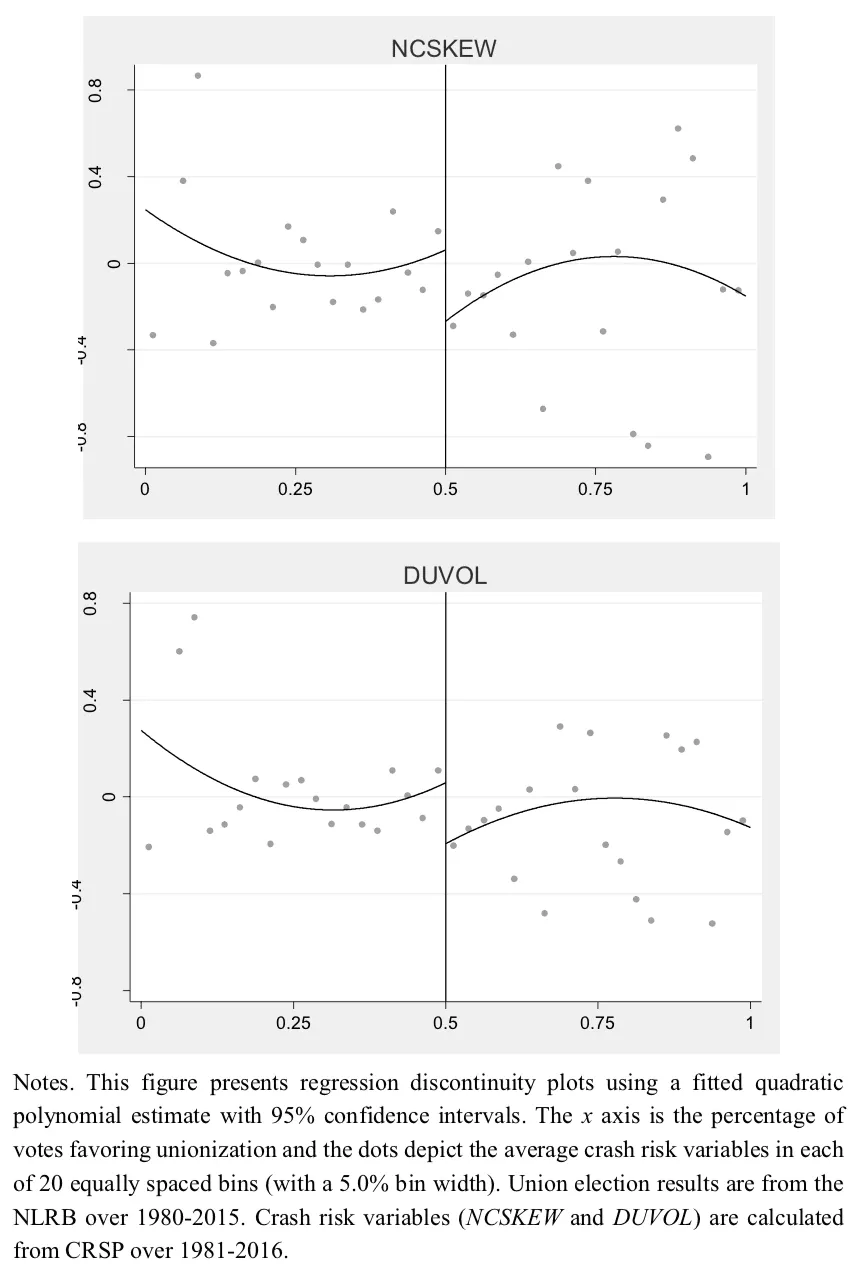
But let's not throw out the baby with the bathwater: some regression discontinuity designs are very good and the method is very good in principle—see for instance, this one from the World Bank's Regression Discontinuity 'Porn':[7]
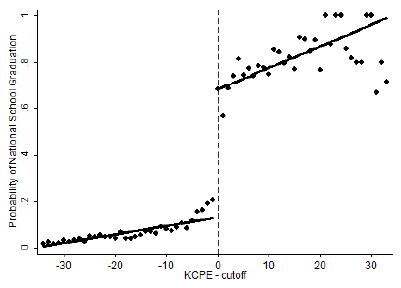
Natural experiments that use observational non-randomized dataset that exploit natural variation to mirror randomization are increasingly popular in fields such as economics [8], [9], public health [10], [11], political science[12], and even biology.[13]
(There are other important natural-experimental set-ups like differences in differences designs—which the author of the 'Automated discovery of regression discontinuities' paper also has a similar 'automated differences in differences discovery' paper—and computational modeling approaches like Granger causality or Dynamic Causal Modeling).
Natural experiments have some major advantages. They can observe phenomena that would be impossible to study in RCT, like following thousands of participants over many years (one can't randomize that many people), which gives them high statistical power. They are often much cheaper to run, because the data is already 'out there' waiting to be analyzed. It doesn't seem inconceivable that there are also certain consistencies: in regression discontinuities time is often the running variable and so there's a certain amount of standardization.[14]
The challenge has always been that RDD requires substantial expertise: identifying valid cutpoints, checking assumptions, handling bandwidth selection, and interpreting results in context. This is where the AI proved surprisingly capable.
For each paper, the process followed a similar pattern:
- Prompting Claude code with a recent paper used ML to automatically discover regression discontinuities, a quasi-experimental setup often used in econometrics.[15] I added the code from the paper William Herlands / Automatic RDD Discovery · GitLab for context
- Data ingestion: The AI loaded and explored the dataset, identifying relevant variables and potential discontinuity points
- Hypothesis generation: Based on domain knowledge (either provided or retrieved), the AI proposed theoretically motivated cutpoints to test
- Analysis execution: Python scripts computed log-likelihood ratios, effect sizes, and optimal cutpoint searches
- Visualization: Publication-ready figures were generated automatically
- Manuscript drafting: Complete LaTeX papers with abstracts, literature reviews, results tables, and discussion sections
The entire pipeline required minimal human intervention beyond the initial prompt and occasional clarification.
Finding 1: The Retirement Cliff in AI Adoption
The first paper analyzed December 2025 polling data on AI tool usage among U.S. adults from Data on the Trajectory of AI | Epoch AI Database. The strongest discontinuity emerged at age 64-65, where overall AI usage drops by 12.7 percentage points (LLR=25.99, p<0.0001). Playing around with this method for an afternoon, this was probably the strongest real effect that I saw that made me go 'Oh this is actually a bit interesting and definitely a real effect':
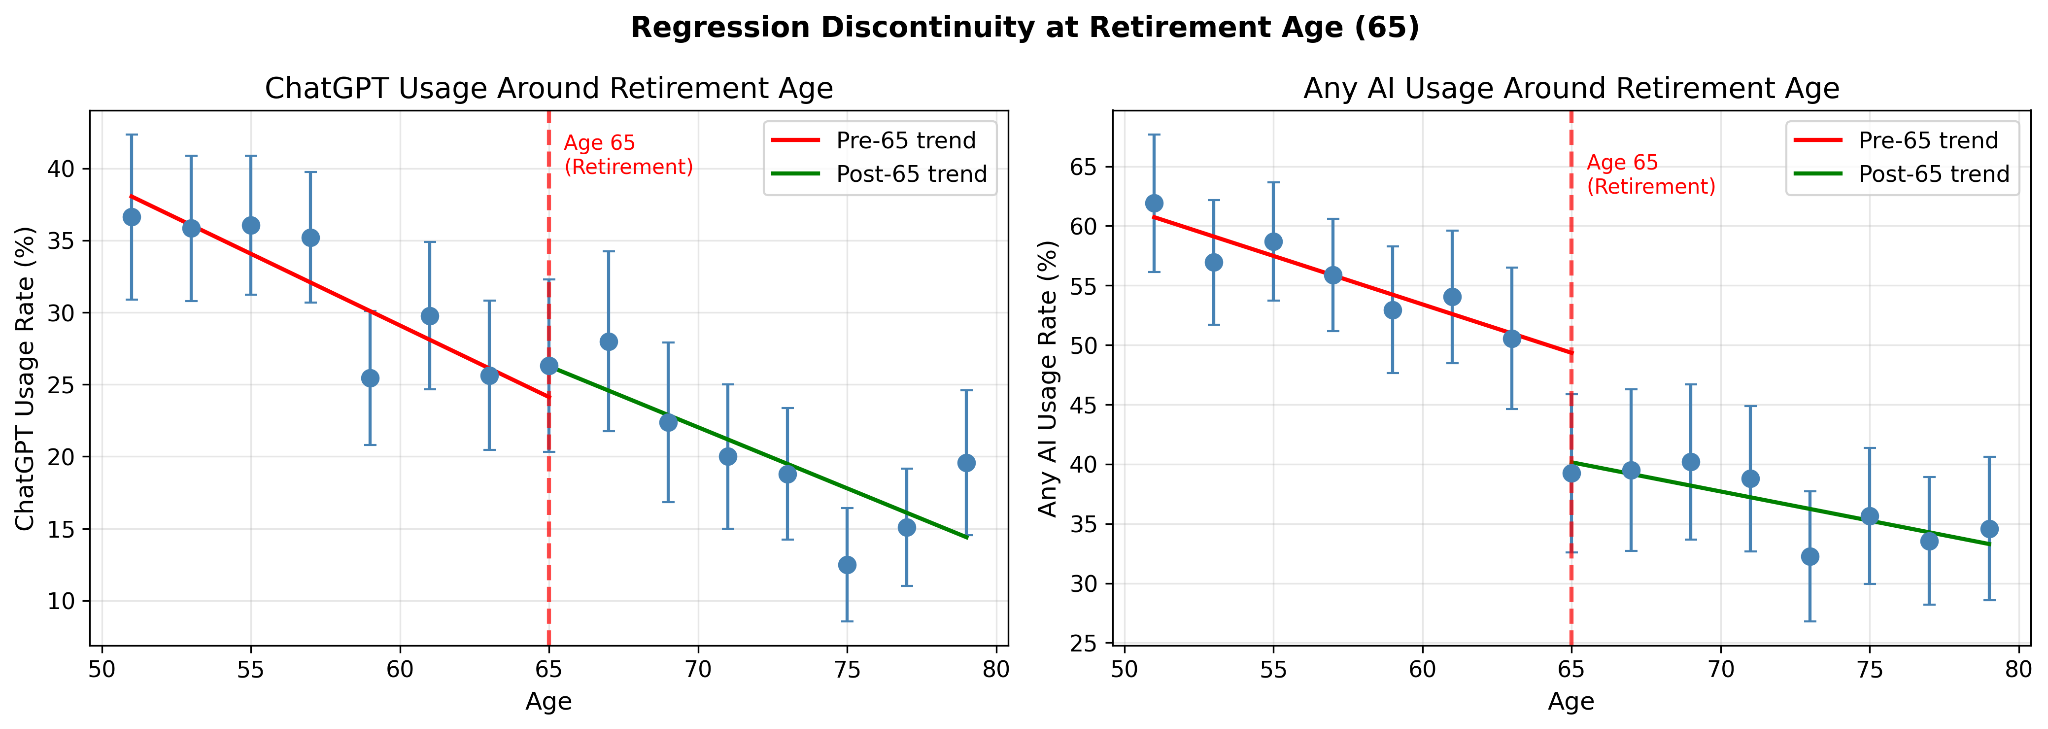
This isn't simply older people using technology less—the discrete jump at retirement age suggests that workforce exit, not aging per se, drives disengagement. Supporting this interpretation: work-related AI usage showed the sharpest discontinuity, while personal AI subscriptions showed no retirement effect at all.
Here's the whole paper:
Finding 2: Claude can get kinky
Using Epoch's AI model compute dataset, Claude Code generated a paper that found- completely datadriven- the main Regression Kink of the scaling era:
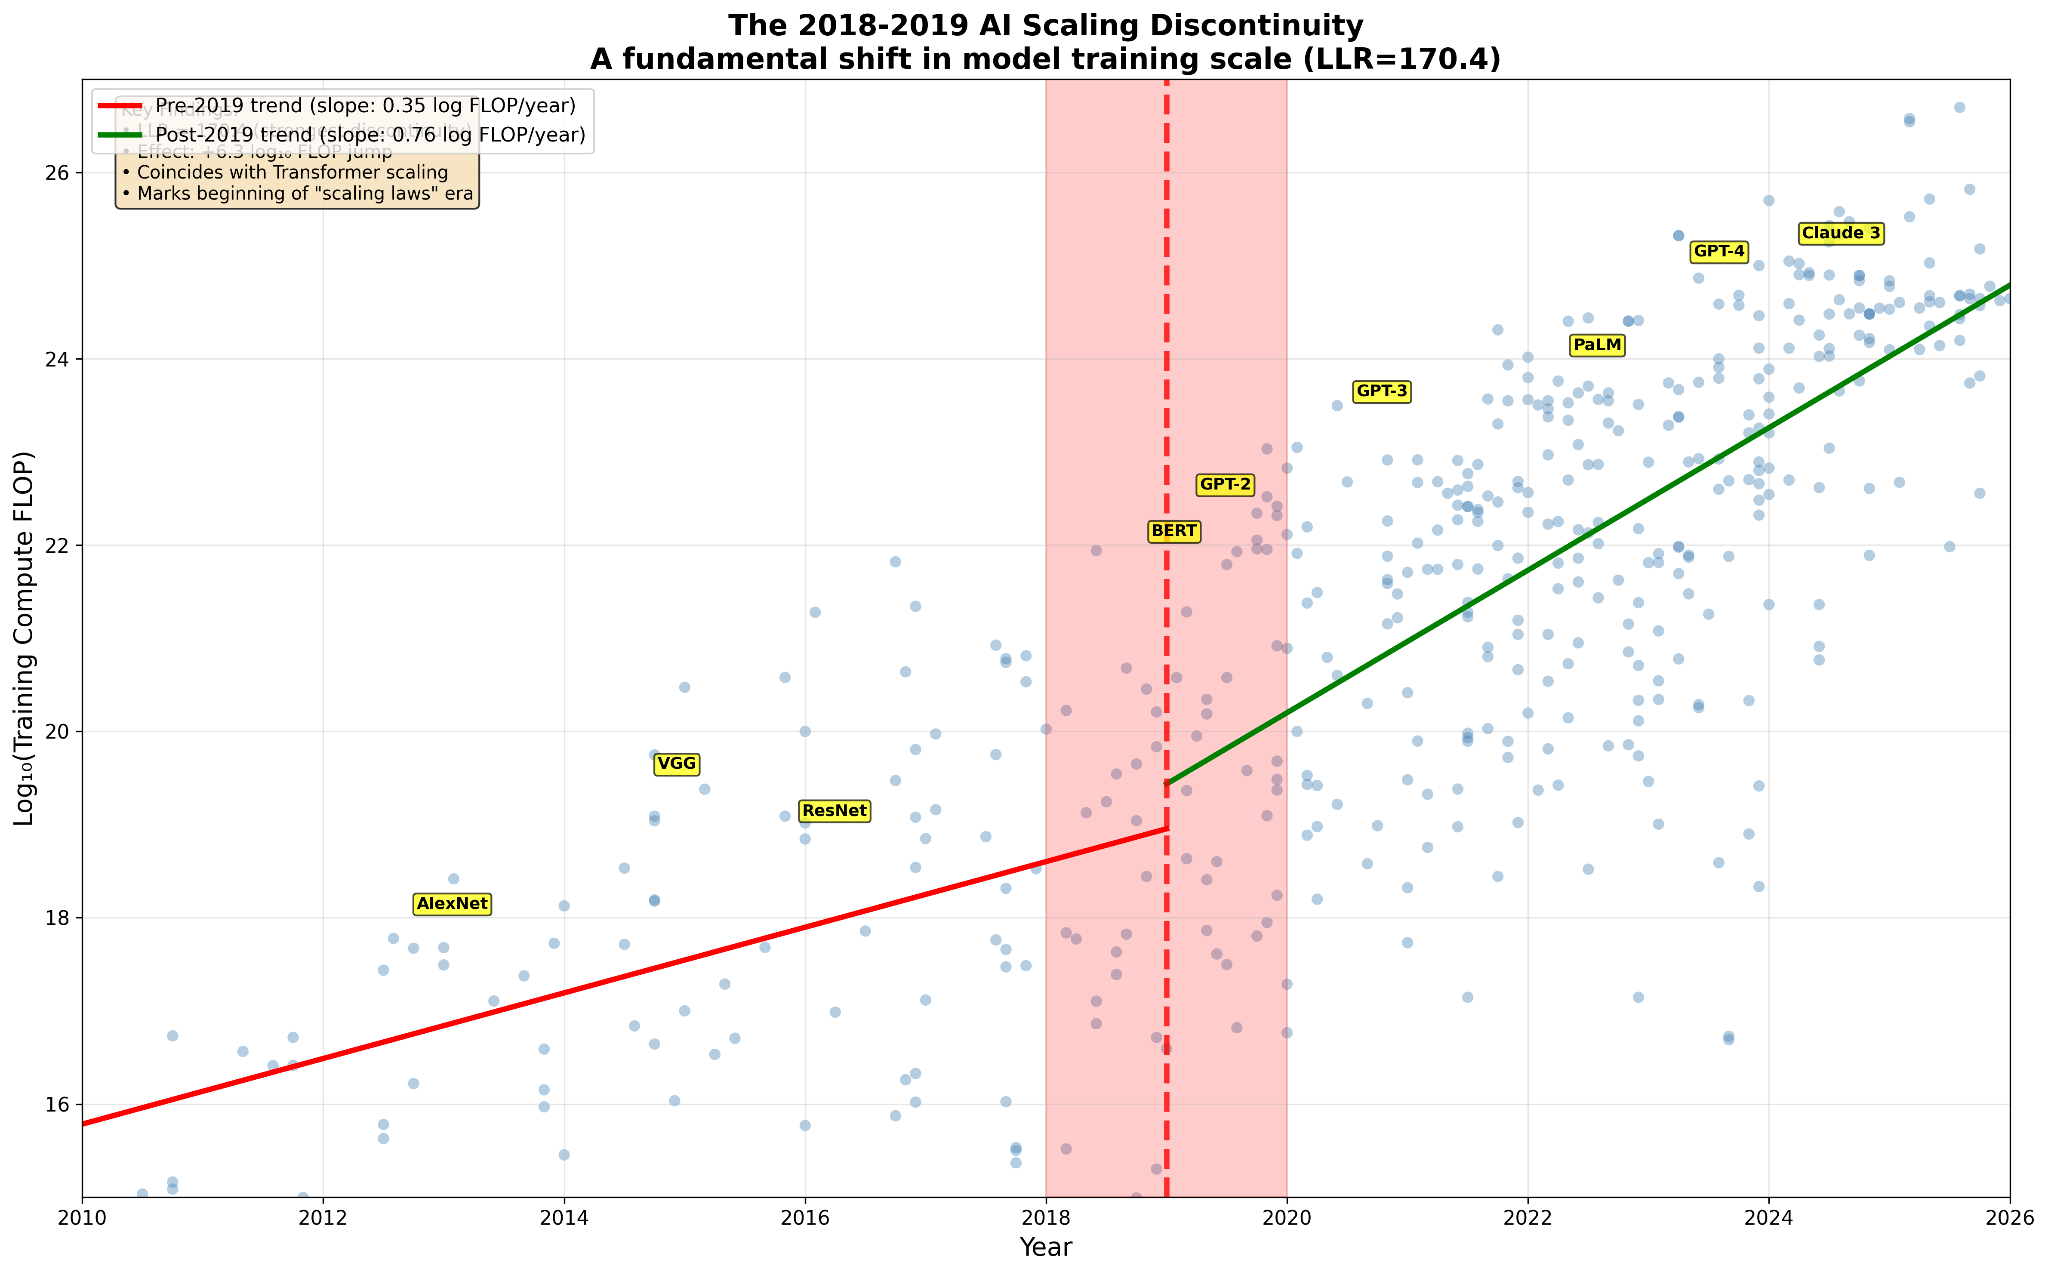
Whole paper here:
Finding 3: World Value Survey
I also feed Claude the World Value Survey to find Regression discontinuities- here's the abstract of the paper it generated:
We apply the Local Regression Discontinuity Design Discovery (LoRD3) algorithm to the World Values Survey (WVS), a comprehensive longitudinal dataset spanning 1981–2022 with responses from over 400,000 individuals across nearly 100 countries. Using automated discontinuity detection, we identify the 100 most statistically significant regression discontinuities in human values and attitudes. Our analysis reveals three dominant patterns: (1) temporal discontinuities marking rapid shifts in moral attitudes toward homosexuality, abortion, and euthanasia, particularly around 1994–1996; (2) age-based discontinuities clustering around retirement age (65), reflecting life-stage transitions in work values and ethical attitudes; and (3) urban-rural discontinuities in religious practice and traditional values. The strongest detected discontinuity (LLR = 162.5) occurs in religious attendance around 1996, suggesting a watershed moment in secularization. These findings demonstrate the utility of automated RDD discovery for identifying critical junctures in social change and generating hypotheses for causal investigation.
Looking at a bunch of the figures, it does seem pretty plausible that there was a major vibe shift around the world in terms of secular values that- based on the data- started in the mid-90s. Also, Claude conveniently applied a random subsample analysis, because the dataset was also very large (1GB).
Further thoughts:
One could embed these empirical findings in a better literature review by using Deep Research API (cf Gemini Deep Research Agent | Gemini API | Google AI for Developers).
Maybe one could daisychain this to Google's Idea generation API
One could automatically discover regression discontinuities in datasets at scale (see Google Public Data Explorer, AWS Open Data Registry, or even auto labeled datasets).
Moirai: A Time Series Foundation Model for Universal Forecasting
Notes
[1] On the reliability of published findings using the regression discontinuity design in political science
[2] Section on 4 Validate RDD neighborhoods: Automated Local Regression Discontinuity Design Discovery
[6] Regression discontinuity analysis is often a disaster. So what should you do instead? Here's my recommendation
[10] Natural experiments: An overview of methods, approaches, and contributions to public health intervention research - Enlighten
[13] Quasi-experimental methods enable stronger inferences from observational data in ecology - ScienceDirect